- About the project
- Object of research
- Chukotka Autonomous Okrug
- The Republic of SAKHA (Yakutia)
- Magadan region*
- Method of research
- Permafrost research
- Hydrology and hydrometry*
- Water balance calculations*
- Geophysical survey*
- Landscape research*
- Observational data
- Anadyrsky district of Chukotka*
- Chaunsky district of Chukotka*
- The Republic of SAKHA (Yakutia)*
- Magadan region*
- Research result
- 2018-2019*
- 2019-2020*
- 2020-2021*
- Maps and photos
- The Anadyr lowland
- Chaunskaya lowland
- Lena basin
- Northern Priokhotye*
- Contacts
- Project participant
* — page under construction
Method of research
Permafrost research
Permafrost-hydrometric survey
The survey involves an area survey of river catchment basins (20-100 km sq) using a network of mapped profiles. The detail of the survey corresponds to the scale 1:100 000 — 1:50 000 (5-10 measurements per 1 km sq). Profiles parallel along the slope with an interval of 750 m, pickets with an interval of 150 m. Profiles parallel along the strike the slope with an interval of 750 m, pickets with an interval of 150 m. Thickening of profiles and observation points is performed in areas with uneven terraced terrain, with signs of active thermokarst and thermoerosion, permafrost heaving. The survey is made during the period of the highest rate of thawing of the active layer (July 5-20).
Observation points are linked to the area using the map and GPS Navigator. At each point, the depth of seasonal thawing is measured with a metal probe 1 m. Several measurements are made in different places: a hummock, a mochazhina, a medallion spot, a peat mound, the results of measurements are recorded in the field book. The humidity of the active layer is measured on the picket using a moisture meter TK100-01 under moss and downy sod at a depth of 15-20 cm. Measurements are made in 3 adjacent places, and the average result is recorded in the description. Humidity is not detected when crossing wetlands. In metal buckets moisture samples are taken on dry and wet tundras from the level of half the depth of thawing from under the peat turf at each 10 picket. The diary describes the location of the observation point: microrelief, soil and vegetation cover, the nature of water flooding, manifestations of permafrost processes, the presence of snow and slope naled. Changes to these conditions are also recorded along the route.
Hydrometric observations are made when the profile of watercourses of 2 and 3 orders intersects. The cross section area is measured using a measuring probe and a tape measure in the channel alignment with a stable laminar flow. Then a micro-wrapper measures the speed of water flow, which is stored in the device’s memory («FLOW-MKR», GR-100). Additionally, a portable conductometer (NDS-3, COM-80) and a pH meter (KL-911) determine the mineralization, temperature, and PH reaction of water. The results of all measurements, a detailed description of the valley slope and floodplain streams are recorded in the field diary. When the route crosses small lakes that are watered by thermokarst subsidence, their depth and area are estimated, the presence and nature of runoff, mineralization, temperature and pH-reaction of water are determined, and the brink or edge of water level and depth of the reservoir are measured at a noticeable point on the shore.
Monitoring the depth of seasonal thawing
Observations of the dynamics of the depth of seasonal thawing are divided into interannual multi-year and intra-seasonal annual.
Interannual multi-year observations of seasonal thaw depth dynamics are conducted at the CALM (Circumpolar Active Layer Monitoring: Long-Term Observations of the Climate-Active Layer-Permafrost System) sites and at the sites created within the framework of this project. Sites with a size of 100×100 m are located within the typical terrain forms and facies of landscapes. Sites with a size of 100×100 m are located within the typical terrain forms and facies of landscapes. Measurements are made in early autumn (after the first frost) using a metal probe on a network of 10×10 m. The main task of long-term observations is to compare the long-term climate dynamics, seasonal thawing and water runoff from typical catchment areas and flat river basins in general.
Intra-seasonal annual observations of the dynamics of seasonal thawing are carried out in key areas of the studied catchment areas. Depending on the tasks to be solved, the monitoring frequency can be planned from 5 to 25 days. The density of the observation network, depending on the size of the key area, is set from 120 to 300 points per km sq, which corresponds to the scale of a reliable permafrost survey 1:25 000 — 1:10 000. Measurements are made on the profiles picketed by hangers using a metal probe of 1 m. Observations of the depth of thawing are supplemented by measuring soil moisture with a moisture meter TK100-01 at a depth of 25 cm. The main task of observations is to compare the dynamics of seasonal thawing, the capacity of the above-frozen horizon and slope runoff. Based on the results of monitoring, it is assumed to link the results of observations to the weather conditions of the warm period of the year and the long-term dynamics of seasonal thawing.
Monitoring the temperature and humidity of the seasonally thawed layer
Long-term monitoring of the temperature of the seasonally thawed layer is carried out at CALM sites using automatic loggers data devices manufactured by HOBO ONSET: H08-031-C01, U23-003, U-12. Temperature sensors are located at depths of 25, 35, 45 cm. The temperature is recorded at intervals of 4 hours.
Seasonal monitoring of temperature and humidity is planned in order to solve the following tasks:
1) determination of daily dynamics of temperature and humidity (dew point) of loose clastic deposits on stony slopes in order to assess the conditions of formation of condensation water runoff;
2) determination of daily and decadal dynamics of temperature and humidity of the roof of the above-frozen underground water horizon of gentle tundra slopes in order to assess the dynamics of its formation and infiltration nutrition.
To solve the first problem, it is planned to install 3 sensors in the mountainous effluent of brooks on slopes of various steepness and degree of turfy. In the absence of significant precipitation for 3-5 days, synchronous measurements of temperature and humidity of clastic loose sediments, automated measurements of runoff (speed of water flow in the range) of the of stream runoff catchment area. In parallel, it is planned to monitor temperature, air humidity and atmospheric pressure.
To solve the second problem at the key site of the study of the supra permafrost runoff it is planned to install 3 sensors on the profile in the cross section of the slope: the watershed, the middle of the slope, and the foot of the slope. Temperature and humidity measurements of the seasonally thawed layer are made synchronously with measurements of the water level in the drainage dug holes located on the profile. In parallel, it is planned to monitor temperature, air humidity and atmospheric pressure. Комбинированные измерения температуры и влажности воздуха производятся с помощью автоматического прибора HOBO ONSET: U23-002. Temperature and humidity sensors are installed at half the thaw depth. The measurement periodicity is 1 hour.
Monitoring of ice content of the seasonally thawed layer
Research is conducted to establish the correlation of the ice content of the seasonally thawed layer with the weather of the summer-autumn period and the spring-summer flow of rivers. Observations are made by direct determination of the frozen seasonally thawed layer, and by geophysical methods (mini WEZ).
As auxiliary equipment for the selection of ice and frozen ground STS are used: a metal pipe (sampler) 110×2, 8 cm with sharpening in a circle at one end; a wooden ramrod 120×2 cm; a sledgehammer 6 kg on a rigid handle; a locksmith’s hammer; a wrench. The ramrod and pipe must be placed in bright paint after 5 cm.

Sampled is advisable to carry out in the established spring weather with an air temperature of +5 — (-5) °C (may — the first decade of June). The sampling profile should be located in the cross of the slope extension within the typical landscapes of the studied catchment areas. Mark the sample points at intervals of 50-100 m depending on the variability of the terrain profile. Sampled is planned to be conducted in the spring of 2018, 2019, 2020, and 2021.
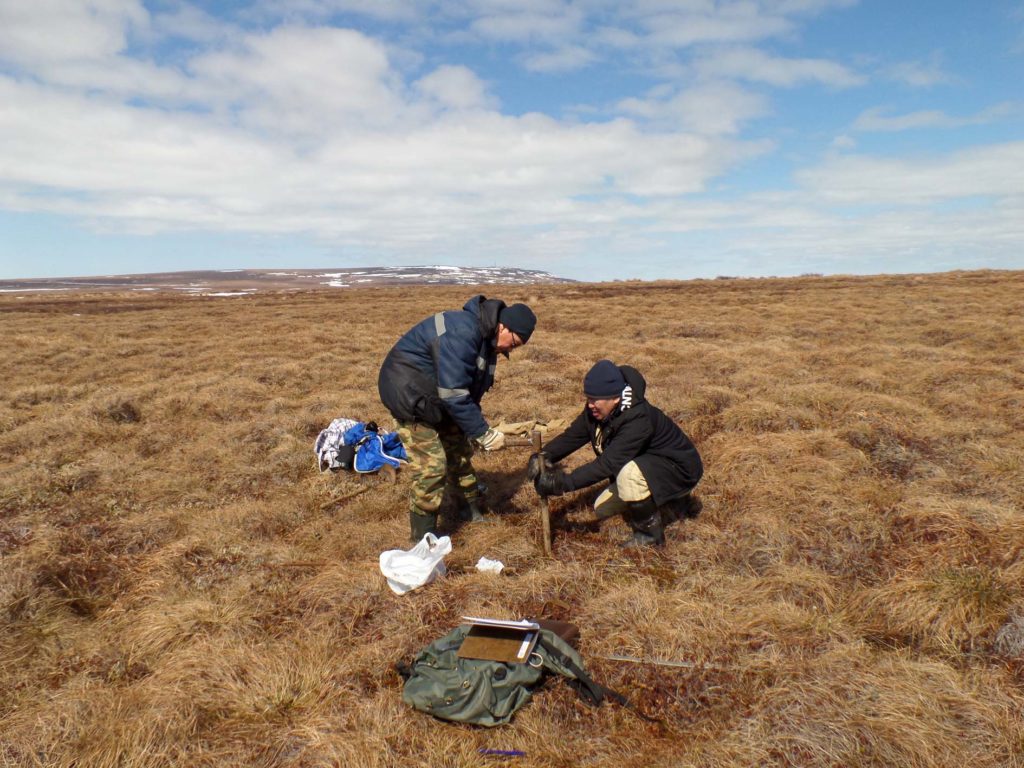
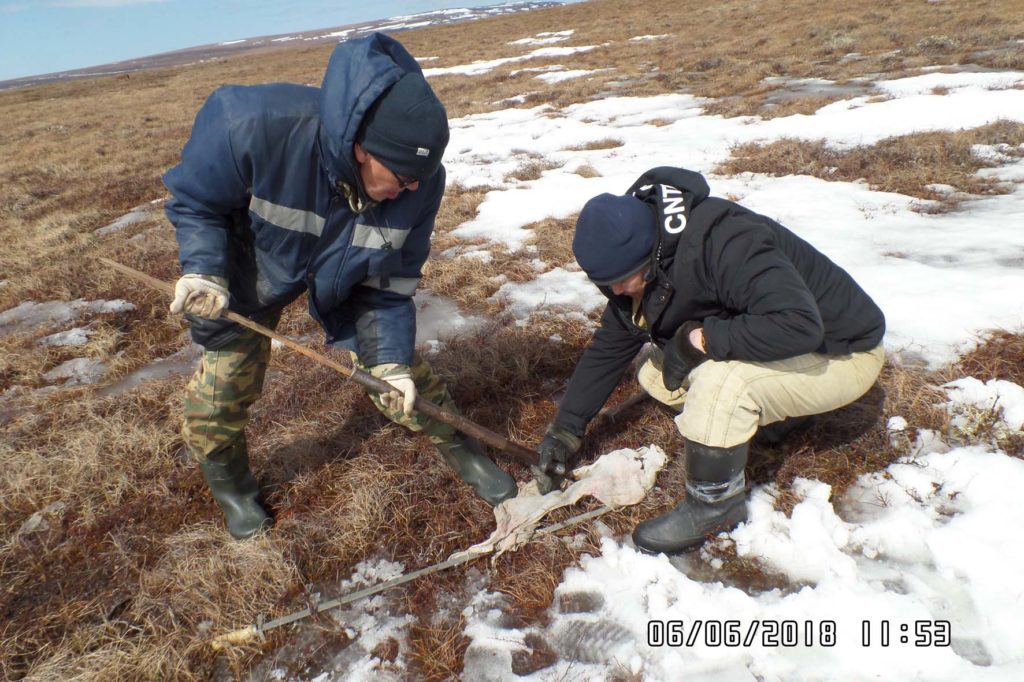
Each point is fixed with a marker and GPS coordinates. The sampler is installed vertically and hammered to the required depth (5-7 cm). In this case, the pipe is fixed to half the length with a wrench and rotated during its hammering by 30° in both directions. After the core is taken, the pipe is removed. The core is squeezed out with a ramrod or knocked out with a ramrod and hammer on a clean cloth or plywood sheet, measured with a ruler and Packed in a metal bux with a tight lid. The recommended sample interval is 15-45 cm.
Then, in the laboratory, the bux is weighed, with the lid open, and dried for 2 hours in a drying Cabinet at a temperature of 105 °C. After cooling to room temperature, the bux is weighed again. Taking into account the weight of the empty bux (determined before the start of testing), the weight difference is calculated, the weight of the ice content of the sample is calculated (total humidity — Wtot):
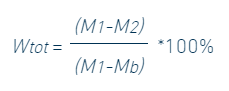
, where М1 — is the initial mass of the sample, М2 — the mass of the dry sample, Mb — is the mass of the empty sample.
And the volume ice content of the sample is calculated (Ii):
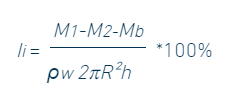
, where ρw — is the water density, R — is the radius and h — is the core length. КIn addition, it is advisable to calculate the amount of water in the STS at the sample interval in liters per 1 m sq and mm of layer. For example, to calculate the water layer in mm (Wh) the formula is convenient:
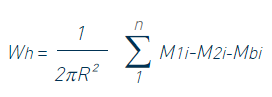
, where the core parameters are set in meters and the sample weight in kg.
The method of estimating ice content by geophysical methods is described in the section «Geophysical research».
Geophysical survey
Geophysical methods are used as auxiliary methods for solving hydrological and hydrometric problems.
It is planned to use geolocation methods to determine the size of underflow taliks and select a location for organizing hydrometric alignments. To determine the ice content of the seasonally thawed layer and the underlying frozen sediments, resistance methods (vertical electric sounding and electric profiling) will be used.
Geolocation methods
We have worked out the technology of applying the method of subsurface geo-radar sounding to study the deep structure of the channel and floodplain of small rivers in the study of the rivers Kazachka, Kolby, Bystraya in 2012-2014. The effectiveness of the method is due to the contrast for electromagnetic sensing of the borders of frozen, thawed and water-saturated alluvium of rivers. The depth of the underflow talik of the Kazachka river estimated by results of georadolocation in 16 m is confirmed by drilling, according to which the depth of the talik is determined in 15 m.